|
wPlot2D version: 0.1.1
A lightweight C++ library for clear and customizable 2D scientific plots.
|
|
wPlot2D version: 0.1.1
A lightweight C++ library for clear and customizable 2D scientific plots.
|
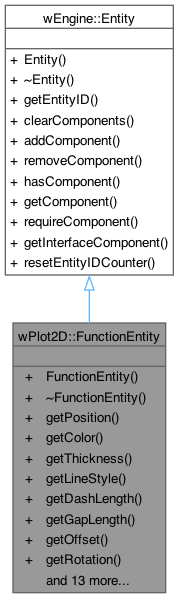
Represents a mathematical function as a drawable entity in a 2D plot. More...
#include <wFunctionEntity.hpp>
Public Member Functions | |
| FunctionEntity (const sf::Vector2f origin, const sf::Vector2f scale, std::function< double(double) > func) | |
| Construct a new FunctionEntity. | |
| virtual | ~FunctionEntity ()=default |
| Virtual destructor. | |
| sf::Vector2f | getPosition () const |
| Get the position (origin) of the function in pixel space. | |
| sf::Color | getColor () const |
| Get the color of the function curve. | |
| float | getThickness () const |
| Get the line thickness of the function curve. | |
| wEngine::LineStyleComponent::LineStyle | getLineStyle () const |
| Get the line style of the function curve. | |
| float | getDashLength () const |
| Get the dash length when the line style is Dashed. | |
| float | getGapLength () const |
| Get the gap length between dashes or dots. | |
| sf::Vector2f | getOffset () const |
| Get the current offset applied to the function curve. | |
| float | getRotation () const |
| Get the current rotation angle of the function curve. | |
| void | setPosition (sf::Vector2f position) |
| Set the position (origin) of the function in pixel space. | |
| void | setColor (sf::Color color) |
| Set the color of the function curve. | |
| void | setThickness (float thickness) |
| Set the line thickness of the function curve. | |
| void | setLineStyle (wEngine::LineStyleComponent::LineStyle style) |
| Set the line style of the function curve. | |
| void | setDashLength (float dashLength) |
| Set the length of each dash when the line style is Dashed. | |
| void | setGapLength (float gapLength) |
| Set the length of the gap between dashes or dots. | |
| void | setOffset (float offsetX, float offsetY) |
| Set an offset applied to the function curve. | |
| void | setRotation (float angleDegrees) |
| Set the rotation angle of the function curve. | |
| void | setScale (sf::Vector2f scale) |
| Sets the scaling factors for the function graph. | |
| void | addExcludedInterval (double min, double max) |
| Add an excluded interval where the function should not be drawn. | |
| void | clearExcludedIntervals () |
| Clear all excluded intervals. | |
| void | alignToYAxis (float normalizedOffsetX=0.0f, float normalizedOffsetY=0.0f) |
| Rotates the function by 90 degrees and swaps scales accordingly. | |
| void | drawFunction (sf::RenderWindow &window, double startX, double endX, size_t nbPoints=1000) |
| Draw the function on the target window. | |
| Public Member Functions inherited from wEngine::Entity | |
| Entity () | |
| virtual | ~Entity () |
| unsigned int | getEntityID () const |
| Returns the unique ID associated with this entity. | |
| void | clearComponents () |
| Removes all components currently attached to the entity. | |
| template<typename T, typename... Args> | |
| std::shared_ptr< T > | addComponent (Args &&... args) |
| Adds a new component of type T to the entity. | |
| template<typename T> | |
| void | removeComponent () |
| Removes the component of type T from the entity. | |
| template<typename T> | |
| bool | hasComponent () const noexcept |
| Checks whether the entity has a component of type T. | |
| template<typename T> | |
| std::shared_ptr< T > | getComponent () const |
| Retrieves the component of type T attached to the entity. | |
| template<typename T> | |
| std::shared_ptr< T > | requireComponent (const std::string &context="") const |
| Retrieves the component of type T and throws if it's missing. | |
| template<typename Interface> | |
| std::shared_ptr< Interface > | getInterfaceComponent () const |
| Returns the first component that implements the specified interface. | |
Additional Inherited Members | |
| Static Public Member Functions inherited from wEngine::Entity | |
| static void | resetEntityIDCounter () |
| Resets the global entity ID counter to zero. | |
Represents a mathematical function as a drawable entity in a 2D plot.
A FunctionEntity manages all components required to render a curve:
The function is sampled at evenly spaced x-values and rendered as a polyline. Excluded intervals and invalid values (NaN, Inf) split the curve into separate segments.
| wPlot2D::FunctionEntity::FunctionEntity | ( | const sf::Vector2f | origin, |
| const sf::Vector2f | scale, | ||
| std::function< double(double) > | func ) |
Construct a new FunctionEntity.
| origin | Logical origin of the coordinate system (pixels). |
| scale | Scale factors for x and y (pixels per unit). |
| func | Function of type double(double) to be plotted. |
|
virtualdefault |
Virtual destructor.
|
nodiscard |
Get the position (origin) of the function in pixel space.
|
nodiscard |
Get the color of the function curve.
|
nodiscard |
Get the line thickness of the function curve.
|
nodiscard |
Get the line style of the function curve.
|
nodiscard |
Get the dash length when the line style is Dashed.
|
nodiscard |
Get the gap length between dashes or dots.
|
nodiscard |
Get the current offset applied to the function curve.
|
nodiscard |
Get the current rotation angle of the function curve.
| void wPlot2D::FunctionEntity::setPosition | ( | sf::Vector2f | position | ) |
Set the position (origin) of the function in pixel space.
| position | The new origin as an sf::Vector2f. |
| void wPlot2D::FunctionEntity::setColor | ( | sf::Color | color | ) |
Set the color of the function curve.
| color | The new color as an sf::Color. |
| void wPlot2D::FunctionEntity::setThickness | ( | float | thickness | ) |
Set the line thickness of the function curve.
| thickness | The new line thickness in pixels. |
| void wPlot2D::FunctionEntity::setLineStyle | ( | wEngine::LineStyleComponent::LineStyle | style | ) |
Set the line style of the function curve.
| style | The new style (Solid, Dashed, or Dotted). |
| void wPlot2D::FunctionEntity::setDashLength | ( | float | dashLength | ) |
Set the length of each dash when the line style is Dashed.
| dashLength | The dash length in pixels (must be > 0). |
| std::invalid_argument | if dashLength <= 0. |
| void wPlot2D::FunctionEntity::setGapLength | ( | float | gapLength | ) |
Set the length of the gap between dashes or dots.
| gapLength | The gap length in pixels (must be >= 0). |
| std::invalid_argument | if gapLength < 0. |
| void wPlot2D::FunctionEntity::setOffset | ( | float | offsetX, |
| float | offsetY ) |
Set an offset applied to the function curve.
The offset is applied after scaling and rotation, allowing the curve to be shifted horizontally and vertically relative to its logical origin.
| offsetX | Horizontal offset in pixels. |
| offsetY | Vertical offset in pixels. |
| void wPlot2D::FunctionEntity::setRotation | ( | float | angleDegrees | ) |
Set the rotation angle of the function curve.
The rotation is applied around the logical origin of the graph. The angle is expressed in degrees, with positive values corresponding to counter-clockwise rotation.
| angleDegrees | Rotation angle in degrees. |
| void wPlot2D::FunctionEntity::setScale | ( | sf::Vector2f | scale | ) |
Sets the scaling factors for the function graph.
This method updates the ScaleComponent so the user can control how much the x and y coordinates are stretched on screen.
| scale | The new scaling vector (scale.x, scale.y). |
| void wPlot2D::FunctionEntity::addExcludedInterval | ( | double | min, |
| double | max ) |
Add an excluded interval where the function should not be drawn.
Useful to handle discontinuities such as vertical asymptotes.
| min | Left bound of the interval. |
| max | Right bound of the interval. |
| void wPlot2D::FunctionEntity::clearExcludedIntervals | ( | ) |
Clear all excluded intervals.
| void wPlot2D::FunctionEntity::alignToYAxis | ( | float | normalizedOffsetX = 0.0f, |
| float | normalizedOffsetY = 0.0f ) |
Rotates the function by 90 degrees and swaps scales accordingly.
This is a common operation when we want to interpret the function's values along the X-axis instead of the Y-axis (or vice versa). The method:
| normalizedOffsetX | Relative offset along X after rotation, expressed in units of (oldScaleX / oldScaleY). |
| normalizedOffsetY | Relative offset along Y after rotation, expressed in units of (oldScaleY / oldScaleX). |
| void wPlot2D::FunctionEntity::drawFunction | ( | sf::RenderWindow & | window, |
| double | startX, | ||
| double | endX, | ||
| size_t | nbPoints = 1000 ) |
Draw the function on the target window.
| window | Render target. |
| startX | Start of the logical x-range. |
| endX | End of the logical x-range. |
| nbPoints | Number of points to sample (default: 1000). |